|
|
|
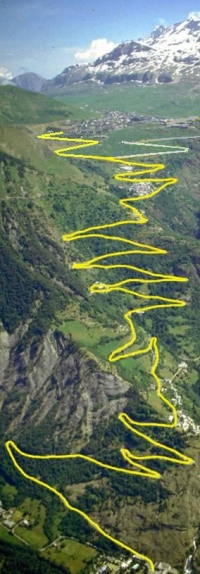
THE TRUTH BEHIND THE CLIMBS OF THE TOUR DE FRANCE During this year's Tour de France, we will time and time again hear the commentators talk of "categories" - about moderate climbs in category 4, and up to the really tough ones which are "beyond category". But does this categorization have some kind of pattern? The Danish website Danskebjerge.dk (in translation: "Danishmountains.dk") has investigated this question by collecting data about all of the 200 categorized climbs which the riders have passed during the Tour of the last three years. [ See updated and revised version of this analysis here! ] The analysis shows that there is a significant difference between the climbs within each category. For instance, in the 2008 edition of the race, there was a category 4 climb with an average grade of 4.6 % through 1.1 km. For professional riders, that's more or less just a bump in the road. However, in the same Tour, the riders met another category 4 climb which had an average grade of 6 % and a length of 2.7 km. That is a climb that may well influence the result of a race. In other words, the term "category" can refer to a wide range of degrees of difficulty, and there are no official rules as to how to distinguish between the categories. Still, certain tendencies can be identified. Danskebjerge.dk has done this by calculating the average value of the length and gradient of the Tour climbs.
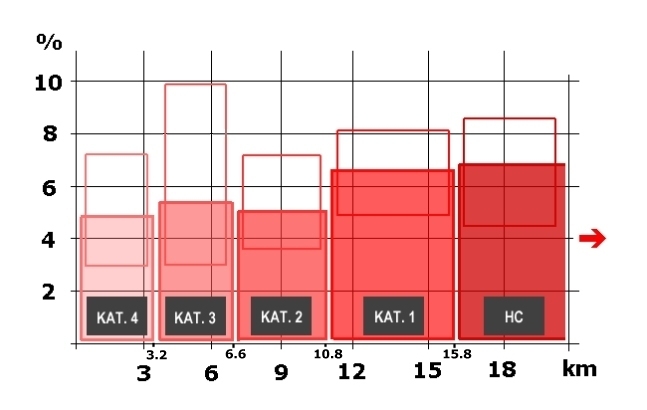
For instance, in category 4 the climbs have a length of 2.1 km and a grade of 4.9 % in average. In comparison the average category 3 climb is 4.3 km long and has a 5.5 % grade. Thus, a category 3 climb is considerably longer than a category 4 climb. On the other hand, the category 3 climb is only marginally steeper. This pattern is rather constant throughout the categorization: It is the length rather than the steepness that determines how a climb is categorized. From the average values of the different climb categories in 2006-2008, the categories can be defined as follows (minimum and maximum values in brackets): Category 4: Length: 2.1 km (min: 0.8 km; max: 4.6 km) Grade: 4.9 % (min: 2.9 %; max: 7.3 %) Category 3: Length: 4.3 km (min: 1.4 km; max: 11.0 km) Grade: 5.5 % (min: 2.9 %; max: 9.9 %) Category 2: Length: 8.8 km (min: 4.7 km; max: 12.9 km) Grade: 5.3 % (min: 3.7 %; max: 7.1 %) Category 1: Length: 12.7 km (min: 7.0 km; max: 19.9 km) Grade: 6.6 % (min: 5.0 %; max: 8.1 %) "Beyond Category"/Hors Catégorie: Length: 18.9 km (min: 11.7 km; max: 42.8 km) Grade: 6.9 % (min: 4.5 %; max: 8.5 %) Furthermore, the analysis shows that the climbs of category 4 are the most common in the Tour de France. Almost every second climb is a category 4 climb, while there is (close to) an equal frequency of climbs from the other four categories.
|